
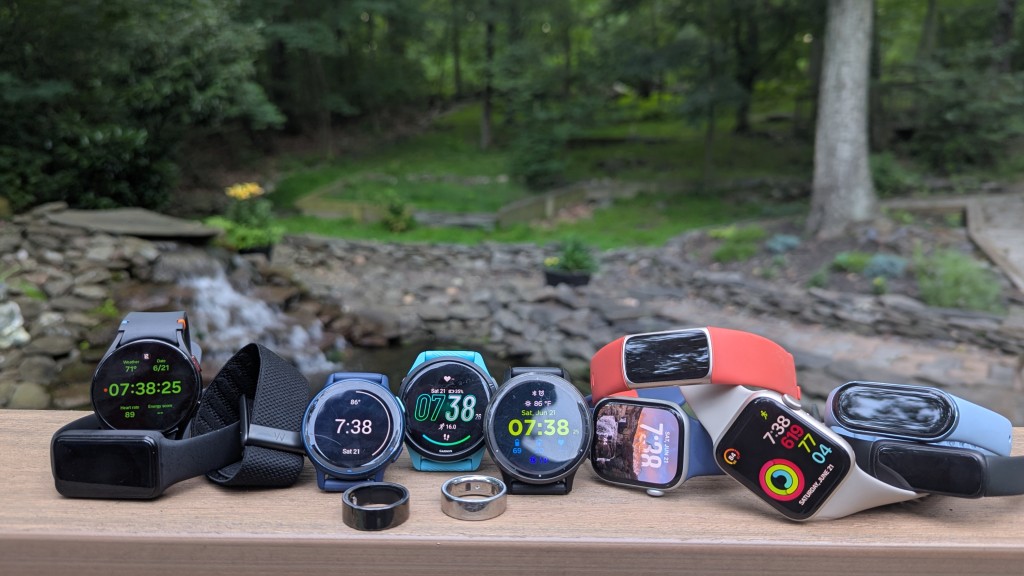
Your Fitness Tracker Might Be Lying to You
Okay, maybe “lying” is a little dramatic But hear me out.
Wearables like Oura, WHOOP, Garmin, Apple Watch, etc. can be awesome tools. I love data and think there’s a lot we can learn from it.
But there’s one thing we have to remember:
Your watch doesn’t know how you feel.
These devices learn YOUR normal. Over time, they establish a baseline based on things like your resting heart rate, sleep, HRV and activity.
That’s usually a good thing. But what if your “normal” isn’t actually that great?
Let’s use HRV as an example.
HRV stands for Heart Rate Variability, which basically measures the small differences in time between each heartbeat. Generally speaking, a higher HRV relative to your normal can be a sign that your body is handling stress and recovering well, while a lower HRV can be a sign that your body is under more stress.
But HRV is VERY individual. Age, genetics, fitness level, sleep, alcohol, illness, training, stress and a bunch of other things can affect it.
That’s why I wouldn’t get obsessed with comparing your HRV to someone else’s.
What I WOULD pay attention to is the bigger picture.
If your watch says you’re “recovered” every morning, but you’re exhausted, sleeping like crap, constantly sore, stressed out and your workouts are suffering…maybe that green recovery score doesn’t tell the whole story.
Your body is giving you data too.
And sometimes we make the mistake of responding to poor recovery by doing MORE.
More workouts.
More cardio.
Less food.
More supplements.
More caffeine.
When sometimes the answer might actually be the opposite.
Maybe you need to eat a little more whole food. Get to bed earlier. Back off the intensity for a day or two. Drink some water. Or simply find a way to reduce some of the stress you’re carrying around.
And this is also why I wouldn’t make huge decisions based on ONE bad HRV reading. I would only make these adjustments if my HRV score in consistently low for a few days or weeks.
Average Healthy HRV by Age Group (Population Norms)
| Age Group | Average Healthy HRV (ms) | The “Alarm Bell” Zone |
| 18–25 | 60 – 85 ms | Consistently under 40 |
| 26–35 | 50 – 70 ms | Consistently under 35 |
| 36–45 | 40 – 55 ms | Consistently under 30 |
| 46–55 | 30 – 45 ms | Consistently under 22 |
| 56–65 | 25 – 38 ms | Consistently under 18 |
| 66+ | 20 – 30 ms | Consistently under 15 |
Note: These numbers represent typical middle-percentile averages for healthy adults. If you are highly physically active, your numbers might track 10–20% higher than these averages.
Because HRV responds dynamically to internal shifts, it’s a great way to test diet changes, exercise changes, and even supplements. If you add a new supplement or drop your carbs and your HRV plummets, your nervous system is telling you exactly what it thinks of that choice, no matter what the health or fitness trends say.
Look for trends.
If your HRV drops after drinking alcohol, that’s useful information.
If it consistently drops when you’re sleeping 5 hours, that’s useful information.
If your recovery starts trending down after adding a bunch of training volume, that’s useful information.
That’s where these devices become really valuable.
Use the technology as another tool in the toolbox, not as the final authority on your health.
Your Oura ring might have a lot of fancy technology packed inside of it…
but it still doesn’t live inside your body.